
- Applications
- Patient stratification
- Patient molecular response · Pilot study
Explore molecular response. Patient by patient.
A Crohn’s disease computational pilot explores how predicted molecular responses differ across patients, CD4+ T cells, and CD8+ T cells, generating stratification hypotheses for follow-up testing.
Model capabilities
SynCausal™
Patient stratification
- Target-specific molecular response
- Cell-type heterogeneity within patients
- Patient-specific target preference
- Regulation strength sensitivity
10
patients in cohort
7
candidate targets
2
virtual suppression levels
3
views: pooled + two T-cell types
Crohn’s disease · CD4+ T cells · CD8+ T cells
One pilot. Two decision lenses.
The target prioritization and patient stratification pages present the same pilot study, viewed through two complementary R&D decisions.
SynCausal™ can be applied across different diseases, indications, and cell types using suitable patient data; this pilot illustrates one biological context.
Illustrative, anonymized case study. Target identities, source cohort, and patient identities remain masked. Outputs are molecular-response hypotheses—not clinical-response labels.
- 01 · Patient molecular response
Read the response in each patient.
SynCausal™ evaluated seven candidate targets at two virtual suppression levels using patient single-cell profiles. The resulting molecular responses reveal differences between patients that a cohort average would obscure.
Direction
Does the predicted molecular shift align with or oppose the patient-matched reference direction?
Magnitude
How much molecular change is predicted? Direction alone does not describe response strength.
Data support
Is there enough evidence in this patient and cell type to interpret the prediction?
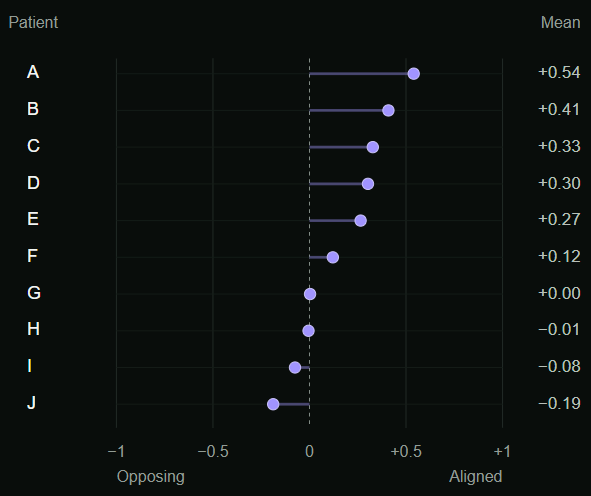
Mean molecular direction
CD4+ T Cells
Reading the patient pattern
Alignment and movement tell different stories.
Patient A shows stronger directional alignment than Patient C. Patient C has greater modeled movement in this panel.
| Readout | Patient A | Patient C |
|---|---|---|
| Mean direction | +0.54 | +0.33 |
| Mean movement | 1.03 | 1.29 |
Movement is a model score, not a clinical effect size. Absolute effect sizes across patients and cell types are not calibrated.
Question for follow-up
Which patient states differ in both the direction and size of their predicted response?
Each mean summarizes fourteen candidate × suppression-level predictions within one cell type. Values are rounded for display. These panel summaries do not classify patients or establish their response to every intervention.
Stratification implication
Explore the molecular response in each patient, then examine which intervention, cell type, and suppression level explain the differences. A panel summary is a starting point for investigation.
- 02 · Cellular response
Similar direction. A different magnitude pattern.
Within the common comparison panel, patient ordering is more similar across the two cell types for directional alignment than for movement magnitude. A patient-level response hypothesis gains detail when the cell type is considered.
- CD4+ T Cells
- CD8+ T Cells
Patient aliases retained across both analyses
Directional alignment
Similar patient ordering
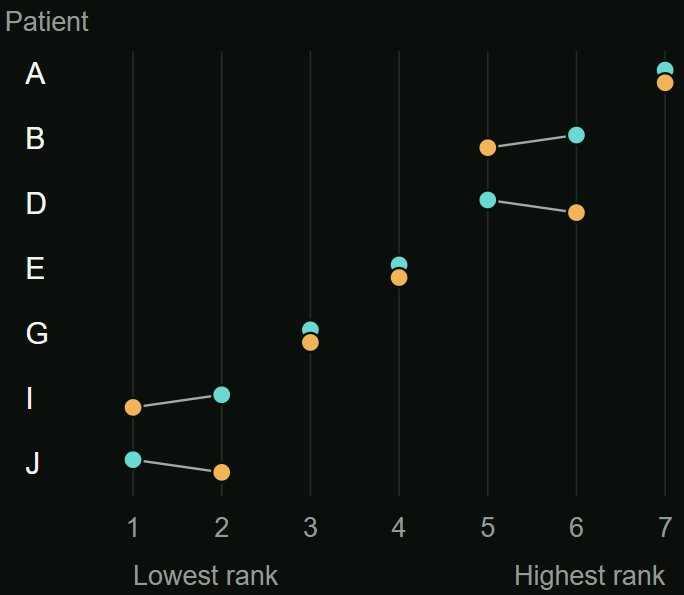
Spearman rank correlation
ρ 0.93
Movement magnitude
Patient ordering changes
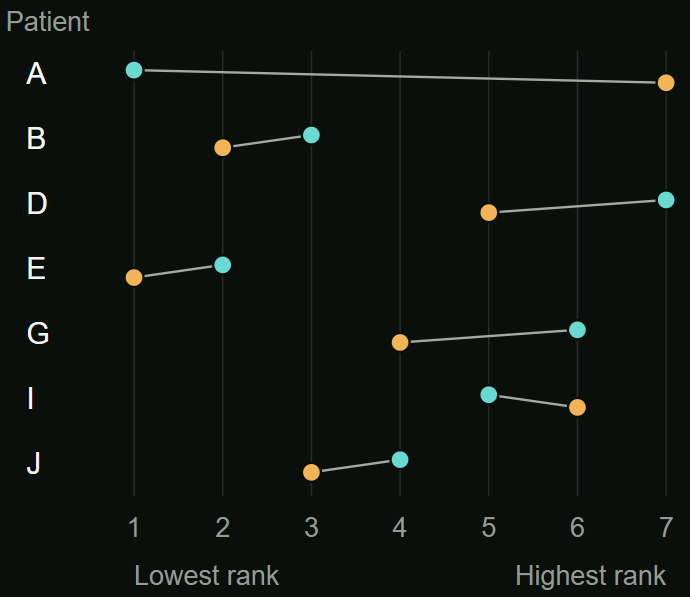
Spearman rank correlation
ρ 0.14
Seven patients with sufficient data support on a common four-candidate panel. Ranks run from 1 (lowest) to 7 (highest) within each cell type. These descriptive correlations summarize this pilot comparison; they are not model-accuracy measures.
Patient example
Patient A ranks highest for direction in both cell types, while their movement rank changes from lowest to highest. Direction alone would miss this cellular response contrast.
Interpret only where the data support the comparison.
Low cell coverage and unstable estimates limit interpretation. A patient excluded from this cell-type comparison may still contribute to another analysis view.
- 03 · From response to stratification
Define the patient hypothesis to test next.
The pilot identifies molecular response differences to investigate. Follow-up connects those differences to the patient states, cellular programs, and intervention conditions that may explain them.
Example follow-up workflow
Build a test around the patient response pattern.
01
Select patients with contrasting responses
Choose patients whose single-cell profiles show different predicted responses to a defined intervention.
02
Define the molecular readout
Examine cell types and pathway-specific programs that distinguish those patients.
03
Test the stratification hypothesis
Measure the response after intervention and assess whether the pattern extends to additional patients.
Example follow-up workflow. This pilot characterizes response dependencies to guide investigation of the underlying molecular mechanism.
Example Question for an Evaluation Project
Which patients show a distinct predicted molecular response to the intervention—and what evidence would support that distinction?
- Study design & interpretation
Explore the scientific detail
How the pilot was run
Paired disease-involved and matched reference single-cell profiles from ten patients with Crohn’s disease were used to evaluate seven candidate targets at 50% and 90% virtual down-regulation.
Predicted molecular responses were examined in pooled cells, CD4+ T cells, and CD8+ T cells. These are three overlapping analysis views. The paired samples provide a molecular reference for each patient; they are not pre- and post-treatment measurements.
Model output and study readout
SynCausal™ predicts expression profiles across approximately 20,000 protein-coding genes. This pilot evaluated the output using a shared disease-related readout of approximately 1,000 genes selected through pooled-cell analysis.
This broad gene pool may compress signaling differences. Pathway-specific submodules can be examined in follow-up to distinguish patient and cellular response patterns.
Readout
Definition and interpretation
Direction
Cosine alignment between the predicted molecular shift and the disease-to-reference direction. +1 is aligned; −1 is opposing. Zero indicates an orthogonal shift and does not establish an absence of molecular change.
Magnitude
Weighted root-mean-square norm of the predicted molecular shift. It describes the size of the movement and must be interpreted alongside direction and support.
Support
Low cell coverage and unstable estimates limit interpretation. Estimates failing the study’s quality criteria are excluded from the corresponding comparisons.
Comparison populations
Depth sensitivity: six support-qualified contexts, five candidates, two lineages. Changes compare 90% with 50% virtual suppression.
Cross-lineage correlation: seven support-qualified contexts on a common four-candidate panel. Other contexts are excluded from that comparison.
What the evidence supports
The ten-context pilot illustrates relative comparison within qualified patient and cellular contexts. Cross-context absolute effect sizes are not yet calibrated.
Virtual suppression levels describe model interventions; they are not drug doses. The study does not establish a universal target rank or a validated clinical response.
Interpreting patient response differences
In this panel, differences between patients account for most directional variation; magnitude reflects both patient and candidate effects. Shared pathway membership and the broad gene readout may compress differences between candidates. A larger cohort, pathway-specific analysis, and experimental follow-up would help assess robustness and test the proposed patient stratification.
- Partner decision package
A patient response map. A focused plan for validation.
A partner program connects molecular response hypotheses to the patients, cellular readouts, and supporting evidence needed for follow-up.
01
Patient response map
Per-patient molecular predictions for the selected interventions and suppression levels.
02
Cell-type comparison
Shared and divergent response patterns across the cell types under study.
03
Data-support record
Where predictions can be interpreted and where additional evidence is needed.
04
Validation priorities
Patient contrasts and molecular readouts for testing stratification hypotheses.
Your patients · your program
Explore the patient response question in your program.
Define the intervention and relevant patients, then connect predicted molecular differences to a focused validation plan.